Span of control: what is the optimum and what are the drivers?
A framework for thinking through an ideal span of control.
Almost no question is asked more than what the ideal span of control should be. There are those that believe the answer is pretty simple – 8. You should have no more than 8 layers and no fewer than 8 direct reports. This is easy to understand and I’m sure there are situations where 8 is the ideal.
Our view is it all depends. It depends on a large number of factors and dogma is incredibly dangerous. Believing there is a simple answer is a classic example of a rightsizing magic number.
So, if it all depends, are we just stuck? Or is there a minimum and maximum? The answer is no, no and probably yes but we can’t say with certainty what that exact maximum is. By the way, the minimum is a bit of a cop out – 1.
Delayering
By increasing the span of control, you reduce the number of managers and layers in the organization. This gives, all things remaining equal, significant cost savings and improves communication from the top.
In our standard Orgvue demo dataset, we have an organization with 1,505 people and 229 managers, or an average span of control of 6.6. The person at the top of the organization (depth 1/the CEO) has 6 direct reports. The CEO’s reports (depth 2) have an average span of control of 4 while their reports 5.76 and so on, as shown in the below graph.

The actual layout can be seen in more detail in the icicle chart below. Each direct report is pictured below the boss. For fun, I have coloured this by age. From Green to Grey.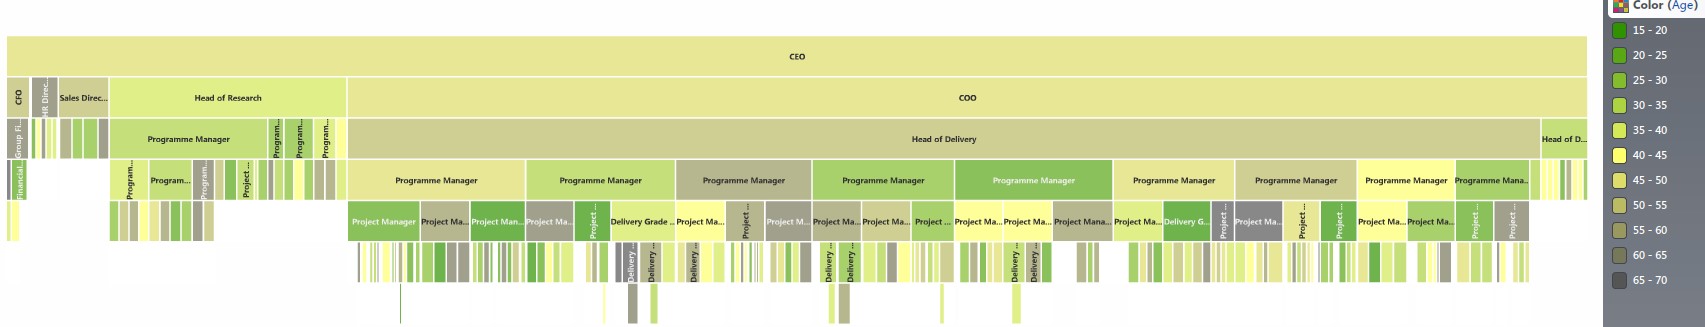
Each of the 7 layers can clearly been seen and it’s immediately obvious that being at level 7 is quite an outlier and some functions only go to depth 3.
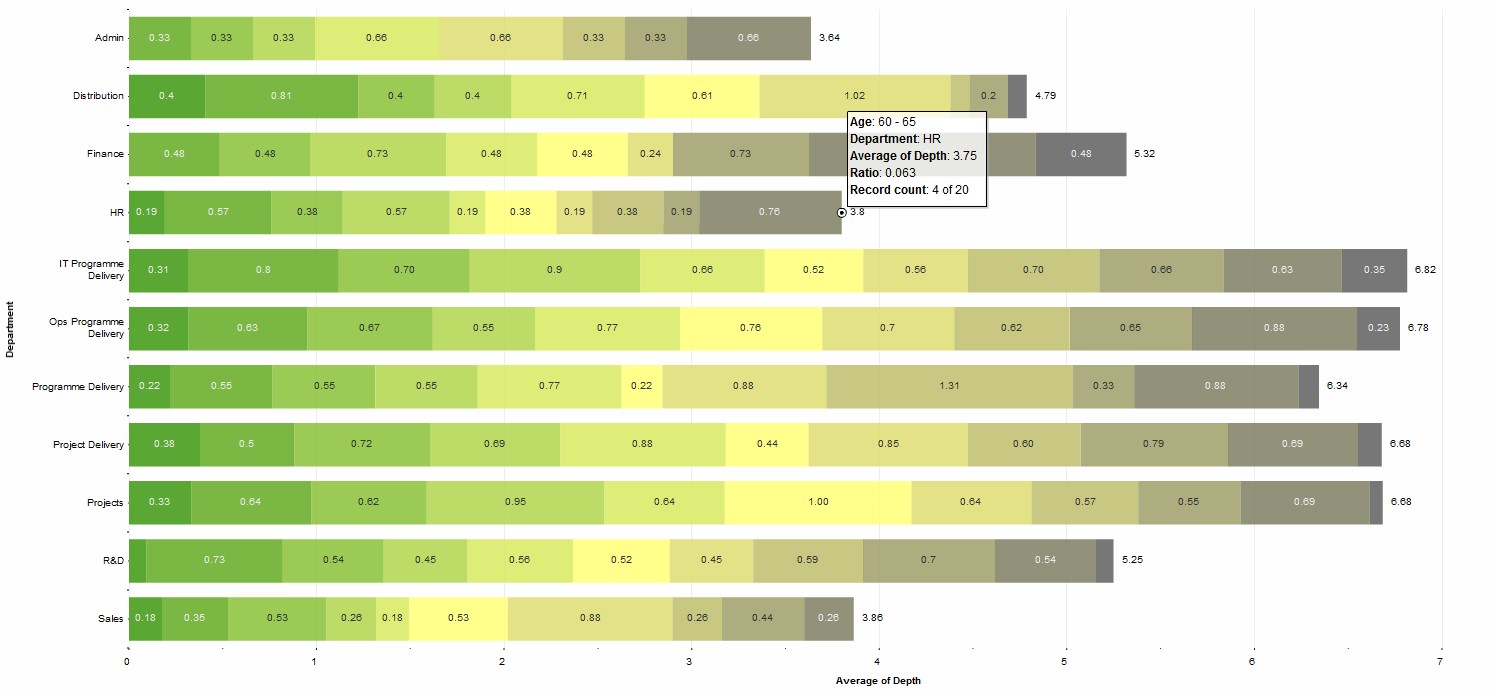
The graph below shows this same data but a histogram of the average depth by department, with the distribution of the age in colour still there.
Understanding this pyramid is useful when thinking through possible delayering savings. It identifies gaps and possible inefficiencies. The simplistic logic of having an average span of control of 8 would decrease the number of managers by 41 to 188. This would mean you only need 5 layers (max depth of 5). This theoretically perfect pyramid would look like the below Excel table.

So, in theory, if you would give us a file with Employee ID, Manager ID (and Employee cost) we would, within seconds, be able to tell you the saving in terms of managers (and likely cost saving/savings range). But reality doesn’t fit such a simple theoretical model. This doesn’t mean such a simple exercise is a waste of time, more that it is useful for highlighting areas to focus in on and a way to raises questions, not answer all those questions.
A framework for thinking through an ideal span of control
Like most problems, it is useful to break it down into various parts. There is the nature of the subordinates, the boss and the overall context of the organization. Each of these have various drivers. Understanding these drivers should help to answer what the span of control ought to be.

Nature of the subordinates
Level of self direction of work and amount of supervision required:
- Capability of workers: If workers are highly capable they will need relatively less supervision
- Motivation, judgement and maturity, autonomy of workers: Are they self-starters? Are they prepared and allowed to make mistakes? Do they know when to escalate and is real trust given? If the answer is yes, then less supervision is required
Degree of similarity of task. The more similar the tasks are, the easier it is to manage more
Nature of the boss
Trust and relationship: The greater the trust, the better the relationships then the easier it is to supervise more
Capability of boss: Does the boss have a good understanding and knowledge of the required work. Think of those new to managing or those who are more junior. Management is a competency like many others and it takes time to develop it
How much ‘task activity’ versus ‘management activity’
- Level of content and technical work required from the manager. If the role has technical deliverables and is required to produce output, not ‘just manage’
- Volume of other tasks, such as membership of committees, involvement in other projects, liaising with stakeholders, the number of direct reports will need to be smaller
- Amount of administrative tasks such as: regular face to face meetings, appraisal and development plans, discuss remuneration plans, explain employment policy changes, recruitment… then the span of control is reduced
Context of the organization
- Level of geographical dispersion: the more widely dispersed a business is, the harder it is to supervise resulting in a smaller span of control.
- How much training and development needs to come from the boss? Is it an apprenticeship model or a direction only model?
- Need for cost savings and perspective on the maximum number of layers
- Culture: How autocratic vs democratic? (the more autocratic, the greater the span of control);
- Amount of change (the greater the change, the greater span of control)
It would clearly be possible to define each group of subordinates and bosses into dimensions based on these drivers. From this, it’s a relatively easy step to deduct which areas should have a higher or lower span of control. High could mean 12 or even 15. Low could mean 5 or even 3 -> with how extreme being determined in part by the organizational context. From this, a gap analysis can be performed and deeper, more meaningful questions asked. Equally, if it is a priority to reduce cost, delayer and increase the average span of control, then why not focus more on the underlying drivers. It is ‘leveraging the drivers’ that will enable an improvement in the span of control ratio. By doing something to improve the drivers e.g. reduce the amount of admin takes; improve trust or knowledge of managers, then any possible theoretical saving might just become a reality.