Activity analysis
Understand the work being done across your organization to ensure you’re investing your resources in the right way
Investing your resources the right way
Are your people spending the right amount of time on the right activities and tasks?
Understanding whether you’re investing your resources in the right way isn’t always straightforward. Exploring the connection between your people and the work being done across the organization requires a considerable effort. This is especially true in large organizations with data scattered across multiple systems or spreadsheets and information being measured in different ways by HR and Finance teams.
So, how do you map the work being done, who has responsibility, and assess cost, so you can evaluate your current state, identify gaps and model your future organization with confidence? Conducting a work activity analysis is essential to ensure proper resource allocation and efficiency.
How Orgvue helps
Orgvue is a SaaS platform that links people data to activity analysis, so you can see the cost and effort of each activity and who’s doing it. It’s purpose-built to enable you to analyze your organizational structure and redesign when needed.
Understand how your business is doing in terms of:
- Fragmentation: are too many people focused on the same activity?
- Functional alignment: Is any team doing something they shouldn’t be doing?
- Overwork: do smaller teams work more hours than larger teams?
- Focus: who in the organization spends the most time on operational work?
- Role clarity: are the different roles and responsibilities clear to everyone?
- Time sink: do some activities drive more overtime than people say they do?

Orgvue shows the individual, their job title and the activities they spend their time on

Orgvue displays details for each activities, including where they’re performed in the business, their nature (strategic, operational and transactional) and their cost
How Orgvue helps you analyze activities
Orgvue helps you see what activities are being done, by whom and where there might be gaps, so you can redesign your activity organization.

Analyze
Analyze how effectively activities are being done
- Merge your HR data with your activity data in Orgvue
- Build an activity taxonomy, so you know exactly what work is being done and by whom
- Understand where there might be gaps and spot areas that need your attention

Design
Model your organization in a safe environment
- Model activities and tasks using Orgvue’s drag-and-drop functionality
- Instantly see the financial impact of your decisions
- Choose the model that works best for your organization

Plan
Use best-in-class methodologies to make your changes
- Use the designs you created to make data-driven decisions
- Plan how you’ll make the move to your future organization
- Put your strategy into practice

Monitor
Track and monitor progress against your plan
- Regularly assess your progress and course-correct initiatives as circumstances change
- Engage stakeholders across the business by exporting and sharing visuals straight to Microsoft PowerPoint
Take advantage of Orgvue’s expertise and best practice
How Orgvue can help you get the right people doing the right work.
Understand your current state
Import data from different sources, such as your finance or HR system, and merge it with activity analytics in Orgvue to understand the work and activities people are doing. From there, build an activity taxonomy that reflects your organization’s service delivery model. You can also use Orgvue’s activity analysis survey to gather information on how people spend their time and add it directly into the platform.

Activity taxonomy in Orgvue, showing what work is being done across the business
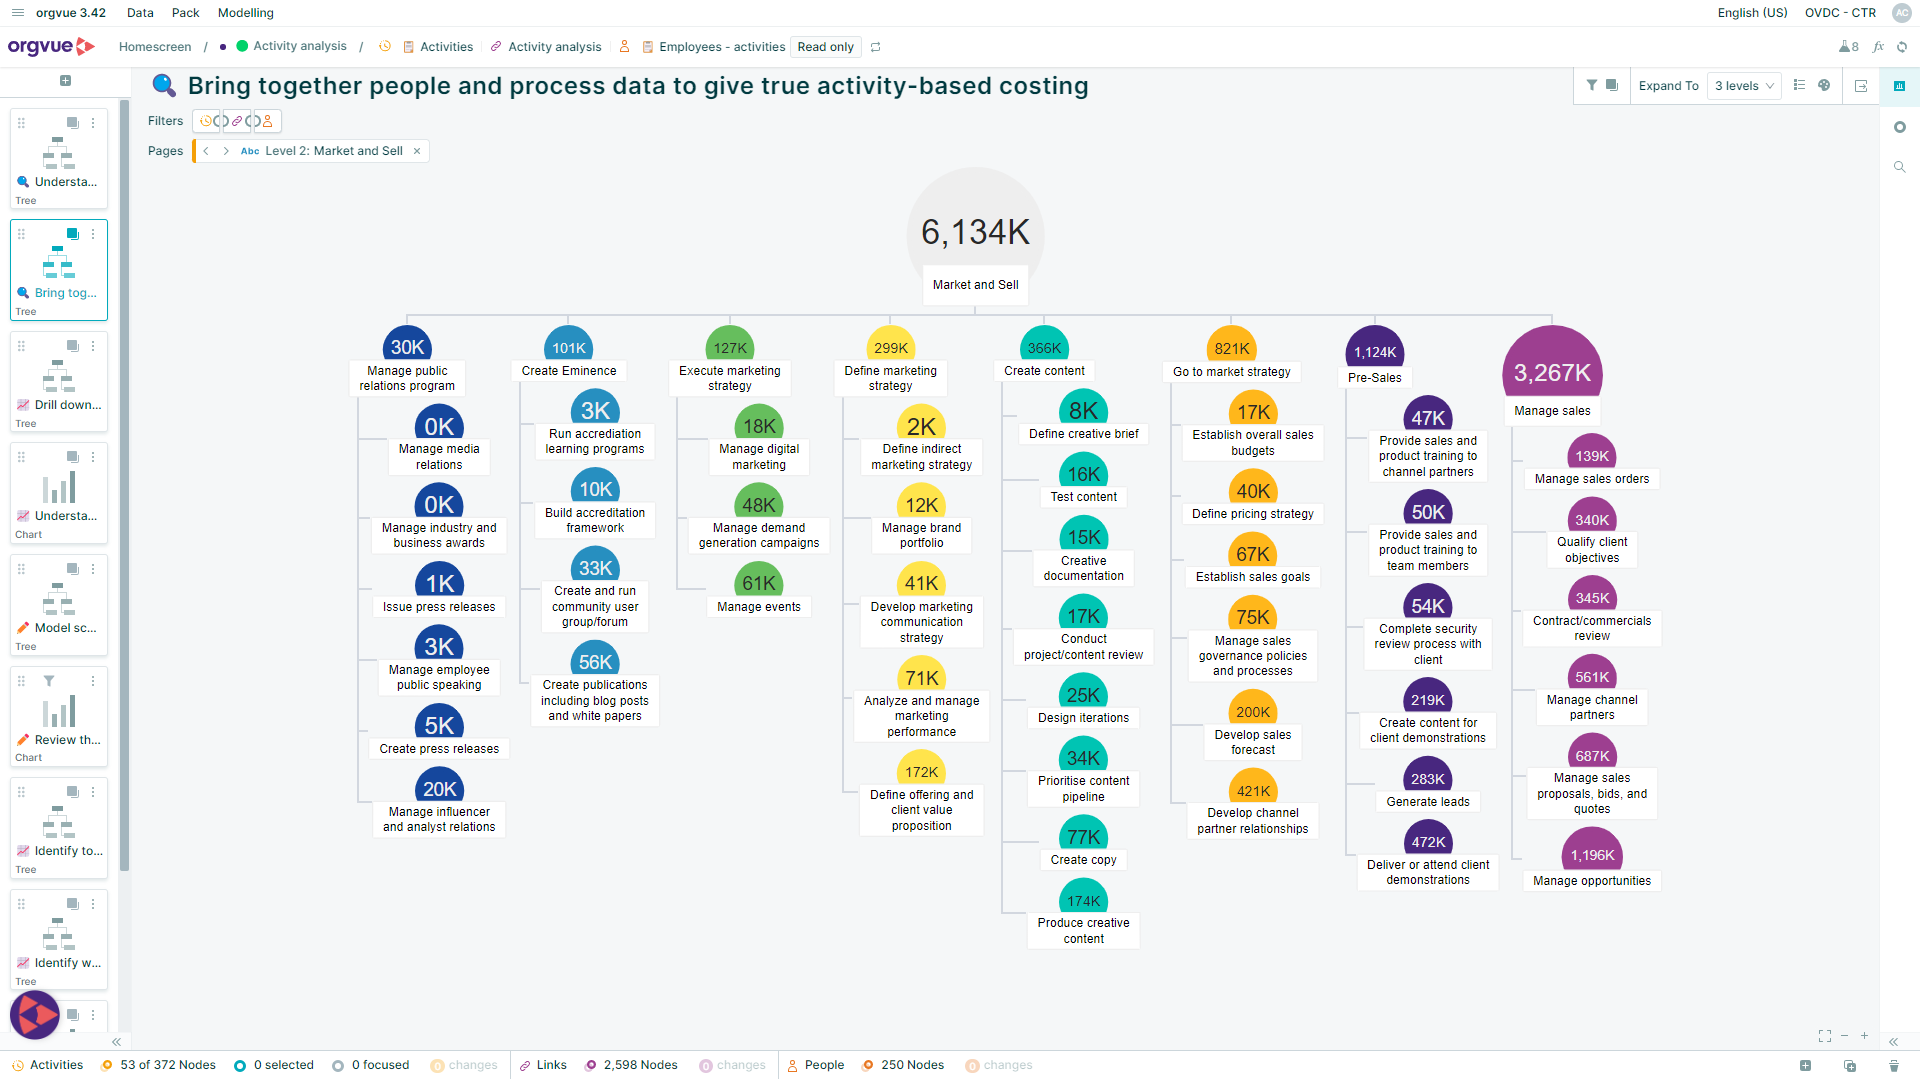
Visualizing the cost of activities: are you over or under-investing in some areas?
Visualize the cost of activities
By combining HR, finance, and work activity analysis data, you can calculate the true cost and effort associated with various tasks. Instead of just looking at people and positions, look at activities and tasks, and analyze how effectively these are being done.
Answer questions such as:
- What is the cost and full-time-equivalent of each activity?
- Should we be spending more time on certain activities?
- What job roles are involved in different tasks?
- Are senior people performing operational tasks?
- Are activities fragmented and can they be consolidated?
Assess if people are doing the ‘right’ work, aligned to their job role
Having understood who performs what work, use Orgvue’s work activity analytics to analyze if people are doing the ‘right’ work. Assess whether people are doing what they’re responsible for, comparing actuals with targets for each role, alongside how consistently work is allocated across similar roles. Use these insights to prioritize opportunities for workforce, organization and process redesign.
You can use Orgvue’s built-in role target setting feature to accelerate role design if data is unavailable from other sources.
Answer questions such as:
- Are people doing the right work?
- Are there opportunities to standardize and clarify role design?
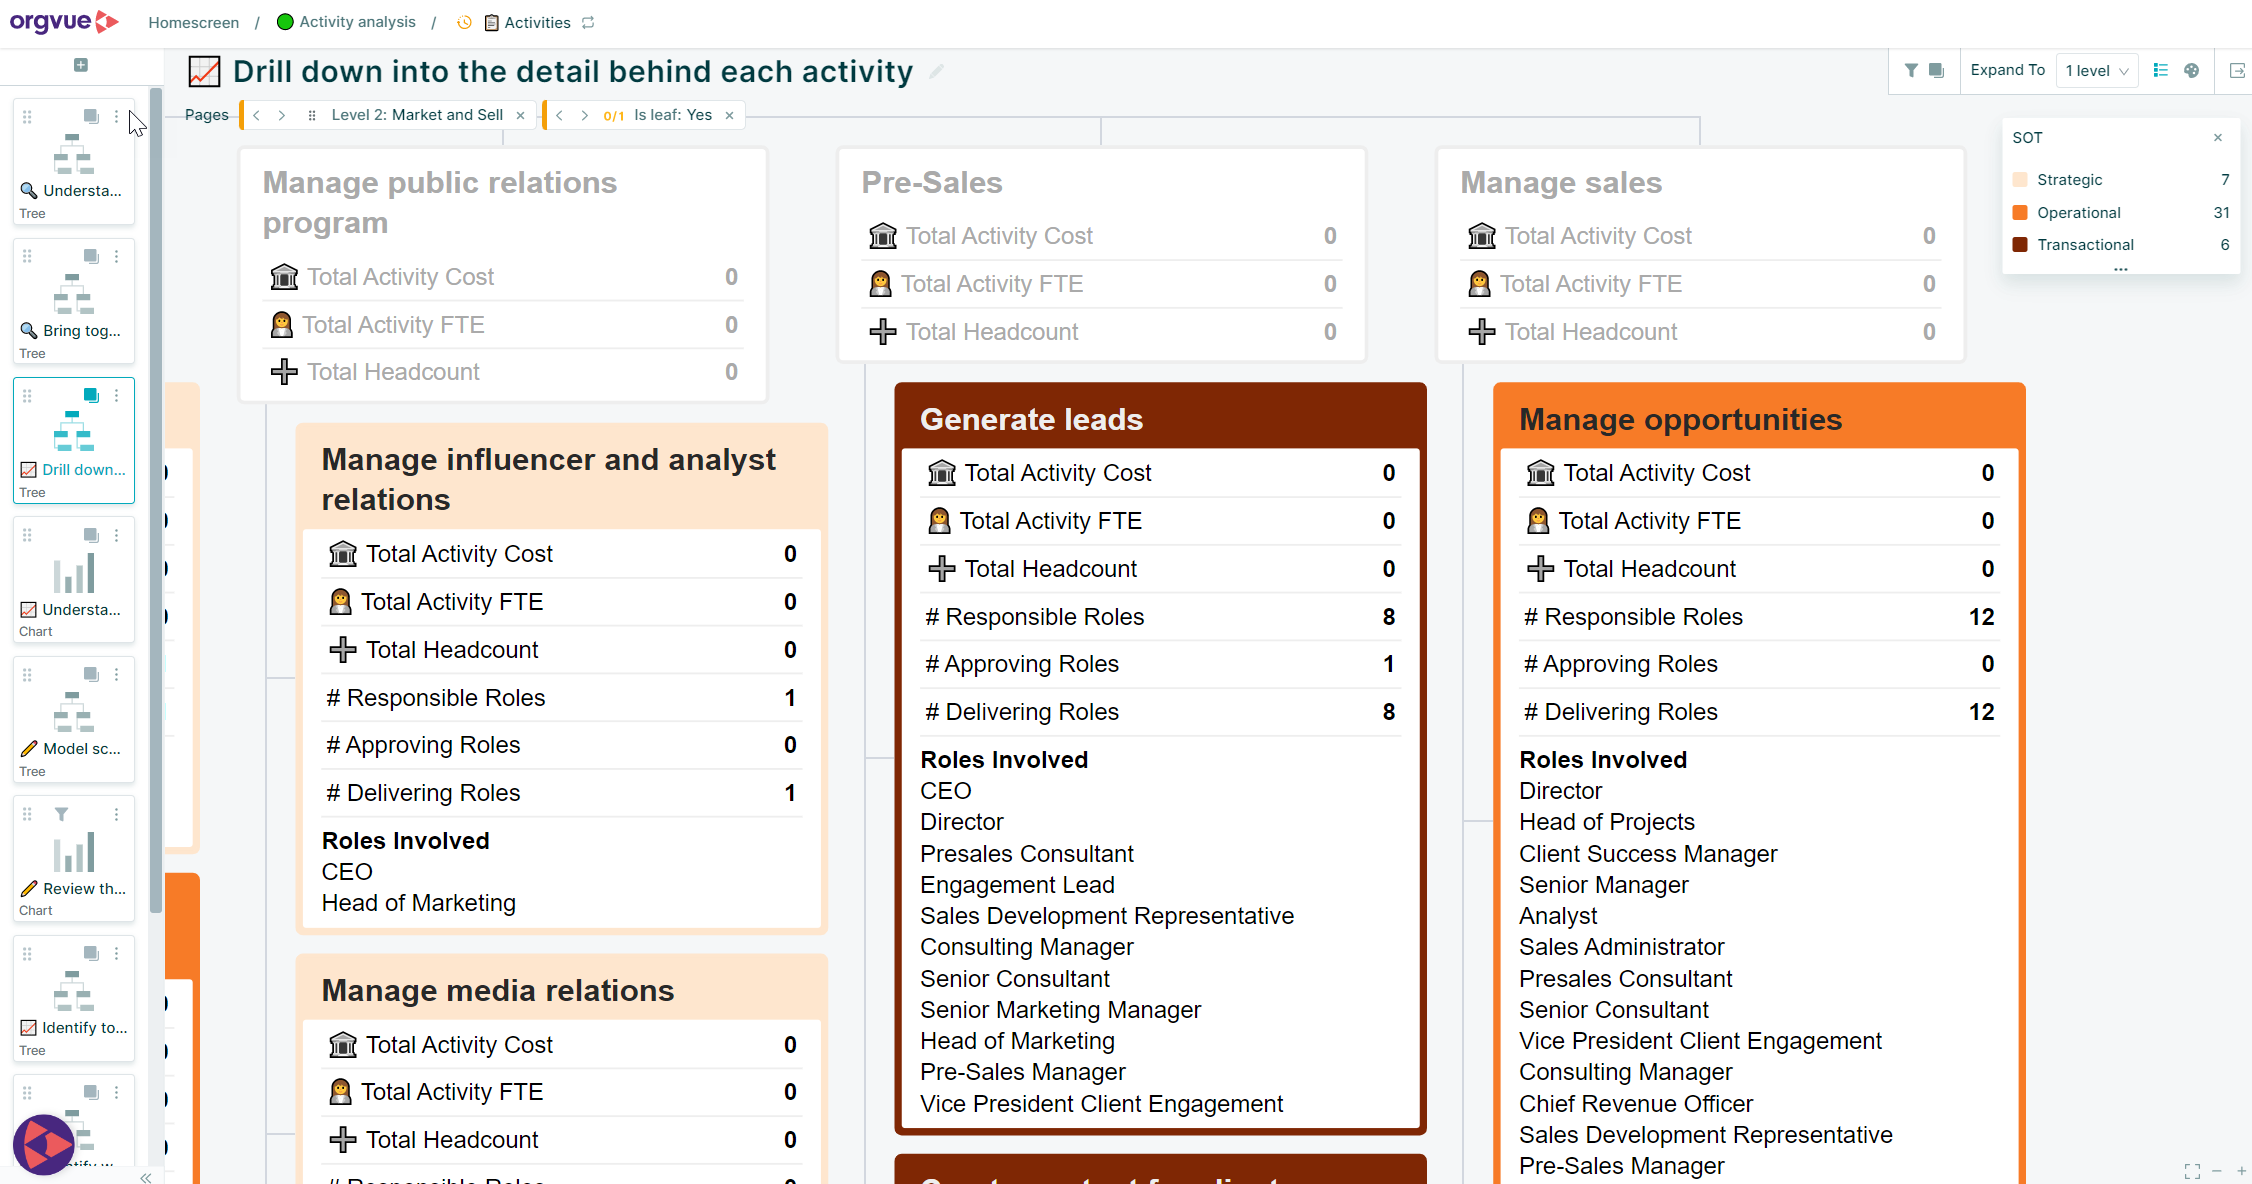
Viewing activities at a granular level: how effectively are these being done? How much is it costing and who is involved?
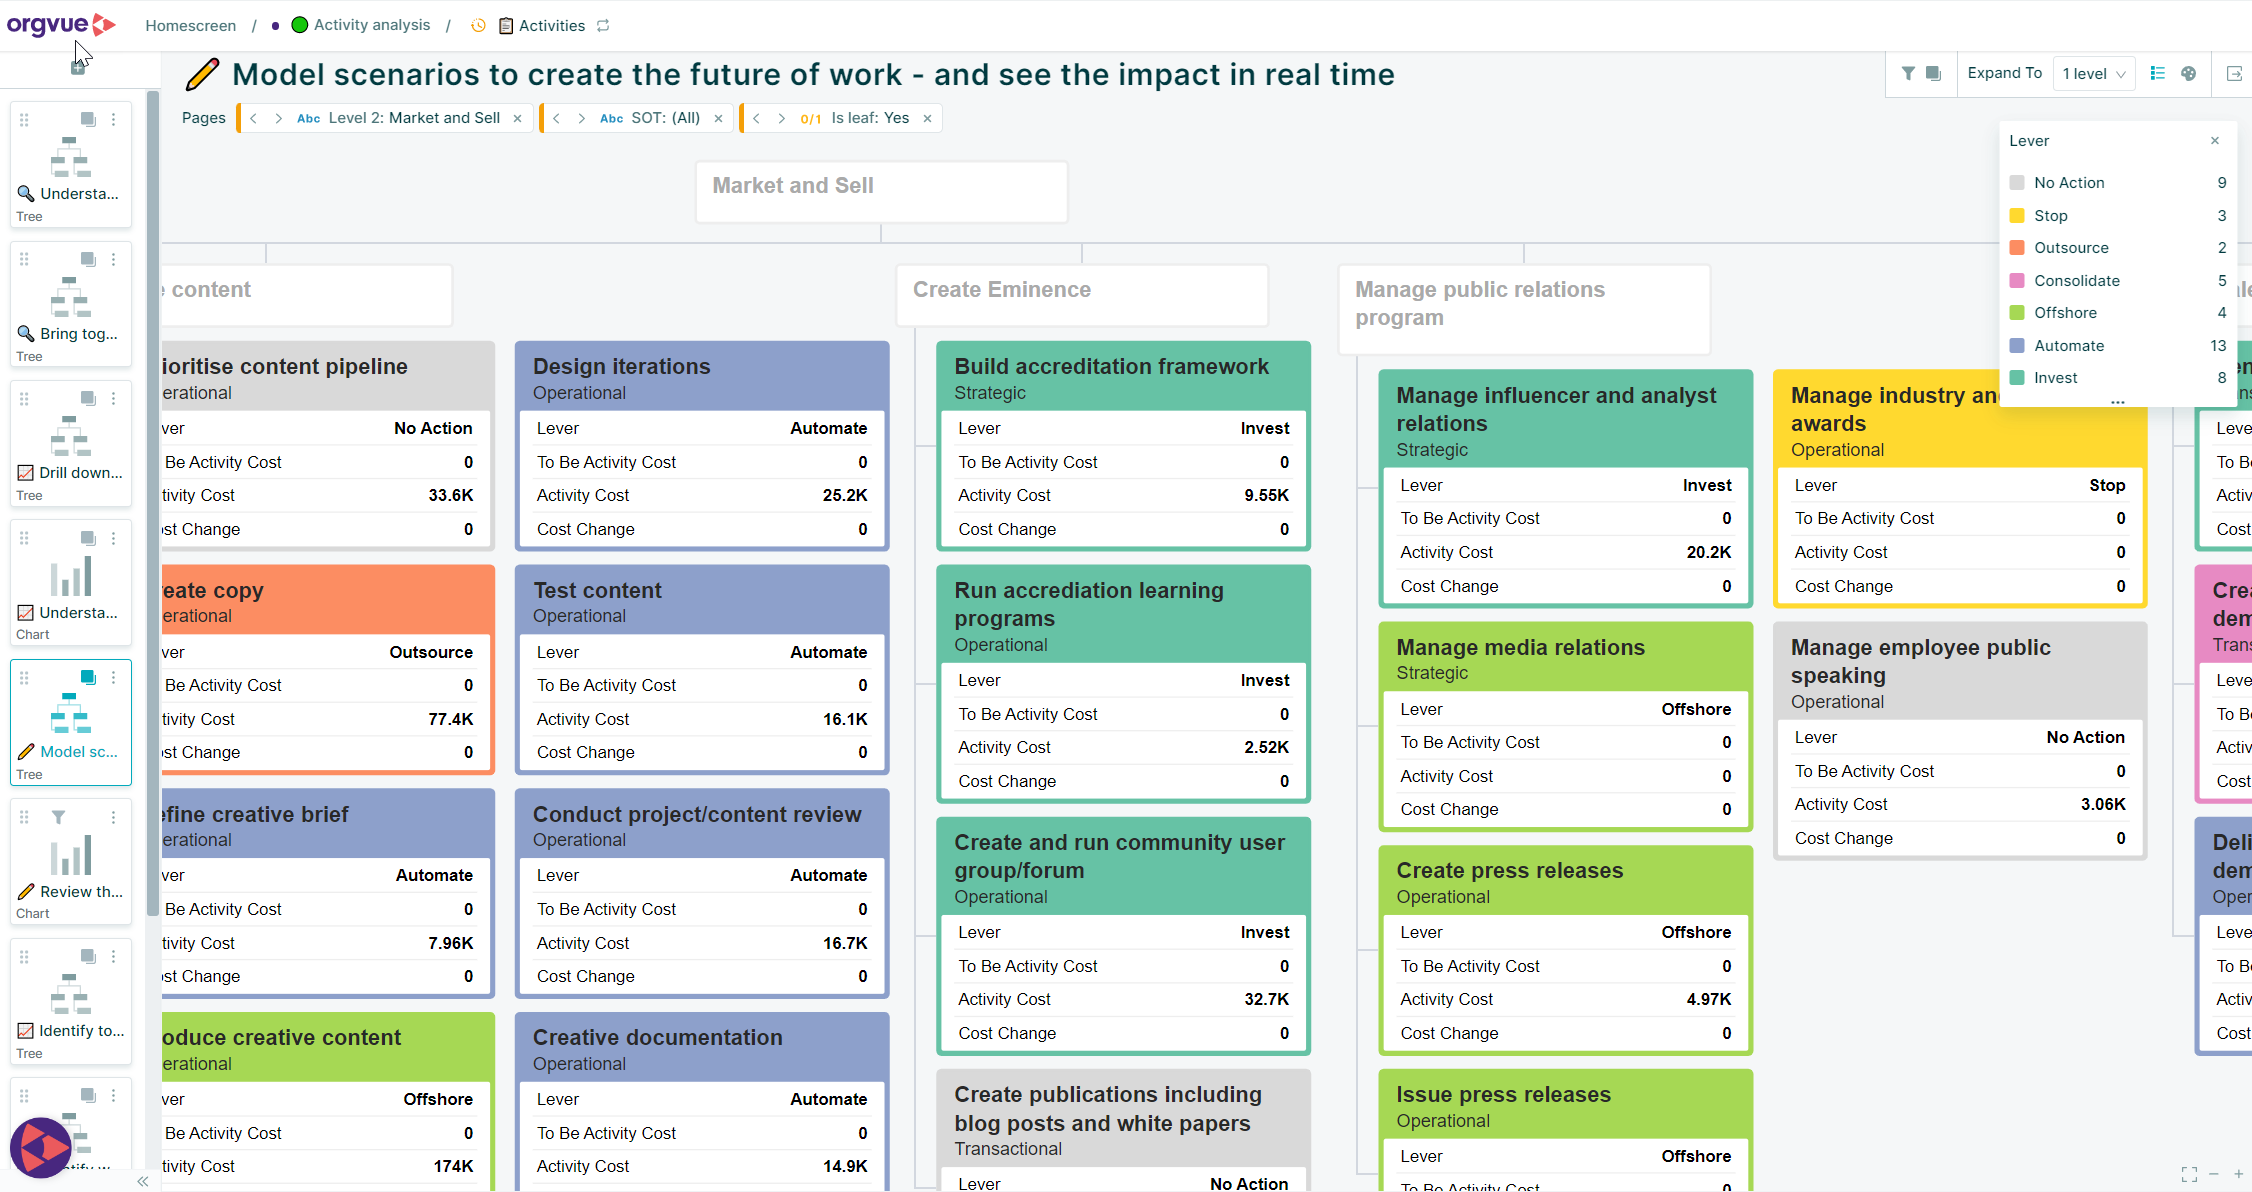
Modeling in Orgvue: making changes to activities using drag and drop, and instantly see the financial impact of those changes
Model scenarios and instantly see the impact on your organization
Using Orgvue’s drag-and-drop functionality, model changes to your organization in a safe environment, reverting back whenever needed. Model the impact of actions such as automating, stopping, offshoring or investing in specific activities. See the impact of your scenarios on the work (what is the new cost of a process?) and people (who will have excess capacity after automating a particular process?) to inform your business case and action plans.
Answer questions such as:
- How will my costs be impacted if I outsource the marketing team?
- What if we automate a process?
- What if I consolidate a task?
Henshaw Assistant
Ask, and your data answers
Henshaw Assistant brings your data to life, giving you instant clarity on your workforce.
Ask questions like:
- Which activities are spread across more than 2 departments?
- Which departments have the highest levels of overwork?
- Which activities have the highest cost?
Customer story
Activity analysis to develop a scalable store model for role design
166
Employees surveyed
166 employees were surveyed from 26 stores.
66%
Identified source of cost
Found that 66% of total cost is spent on admin.
50%
Identified risk
That’s 50% more hours and cost than planned target.

Orgvue was the key to uncover previously unknown truths about how time was spent in store and provided us with actionable insights to optimize the work
VP, Organizational Design
Business goal
- Develop a new global, scalable structure for over 500 stores worldwide
- Allocate time for store roles and assess the relationship each role has with activities
- Optimize work: understand whether employees are using their time effectively
Solution
- Surveyed 166 employees from 26 retail stores, looking at subsets of activities
- Aggregated global employee data to determine time allocation and accountability of roles
- Provided executives with data to confidently redesign roles and their internal labor model, and course-correct in the future

Data sheet
Activity analysis
Download the Orgvue activity analysis data sheet and find out how Orgvue can help with mapping the work analysis that’s being done and assessing its cost.
Understand whether you’re investing your resources in the right way. Discover how to:
- Build a work activity analysis framework to track employee efforts.
- Visualize task distribution and costs with activity analysis templates.
- Use work activity analytics to make data-driven organizational decisions.


See how Orgvue works
We’re excited to show you how Orgvue can help. Before we do, we’ll just need to schedule a quick call to better understand your needs and tailor a demo specific to you.
Complete the form to get started.
Not ready to book a demo?
Submit an enquiry
See our privacy notice. You can unsubscribe from marketing at any time by writing to us at [email protected].
Trusted by