Why will graph databases change?
Why graphing databases are critical to understand business and why they are changing the data landscape.
Graph databases are changing the topography of data
To answer questions about the connections between data points, new technologies are needed. And new ways of dealing with data are now making it possible to list, define, count and quantify some of the items that have never historically been countable. You are increasingly going to be able to say things about your capabilities, about your behaviours, about the processes that you can carry out. Some of these angles on personality have historically been seen more often in novels, in character sketches or in personality tests (‘if you circled mostly Bs …’). But new graphing databases are connecting together people to roles and capabilities and they are enabling new kinds of analysis, both descriptive and predictive. We can now put questions like:
“We are an investment bank. On average, how large are the risks that people of Gender J are accountable for vs. people of Gender K?”
…or…
“We’re a B2B business sales operation with 25% turnover in our sales teams. From the point of view of #1 customer, are our sales teams better this year (in tenure, training and capability) than they were last year?”
Why is graphing conceptually new for economics?
This approach is new because of the number of angles from which the organization can be explored. It’s different from the sheer volume, velocity and variety of data in big data. Until now, it has been possible to use relational databases to carry out specific analyses from a single angle, for example, an analysis of risks allocated to people. (Think of a spreadsheet table containing rows of people listing risks). It has been very time consuming, however, to assemble the data from this single angle, to extract the information needed to complete it and cleanse it. And it has cost the same again to add an extra angle or to repeat the analysis. Most consulting projects start off with lengthy data gathering stages, which can consume a good half of the resource, time and cost. And, despite the cost, this is often why clients ask consultants to help. They know the answers to their questions would be valuable, but that it would simply be too difficult for an internal team to assemble all that data in one place.
Using a graphing database, it becomes possible to link all of these aspects once, to use the model to stay up to date and to see the impact from multiple facets of the organization. The simple change from ‘too difficult’ to ‘possible or easy’ is radical in what it allows organizations to do.
Why graphing databases are critical to understand business
Linking different aspects of an organization reflects the reality of organizational life. We increasingly have ways of categorizing activities and quantifying skills. We talk with our colleagues about skills mix, about the resources we’ll need going forward, about our clients and how we serve them, about who is responsible for what. These are the real conversations that we have about our business and each part of the conversation is linked. The choices we make about who leads on which projects and about who handles which parts of the client relationship has a real impact on how well we manage our business.
Graphing is fundamental to understanding organizations because:
- It’s how humans think. We find it very hard to think in two connected dimensions at once, so we need systems that will let us agree actions in one dimension and see the impact in other dimensions
- It reflects reality. People may carry out multiple roles, have multiple skills and deal with multiple customers or multiple products
- It deals with the lumpiness of change. When change occurs, organizations have to adapt as connected elements linked together. And those connected elements end up with a lumpy item – people.
The final point means you can trace through the chain from customer to organization:
- New services will require new processes
- New processes will be clustered into new roles
- The new roles will require new skills
- And the new skills have to be delivered by people who will have a mixed bundle of skills, and the people (and their time and skills) are non-fungible
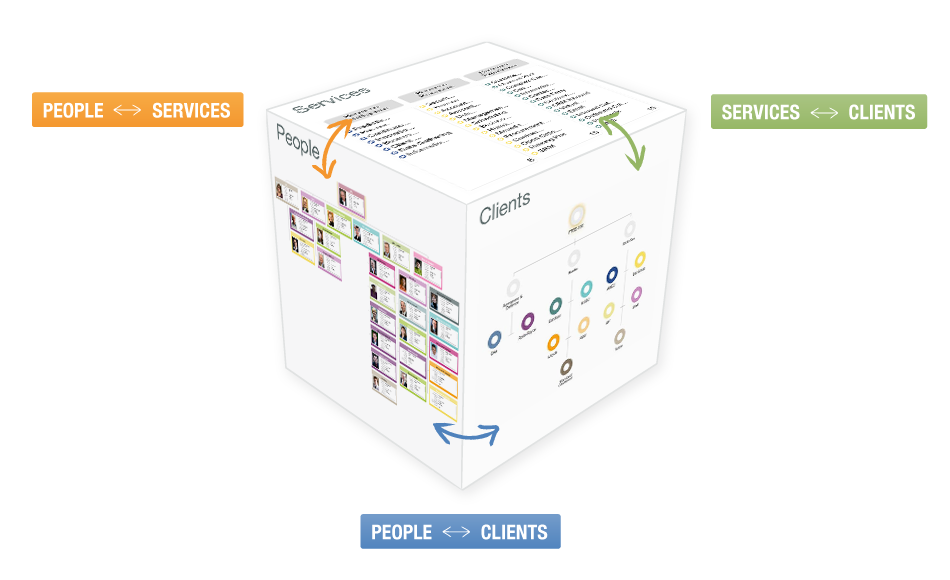
Graphing databases allow you to deal with the complex connections between each stage of this chain. They allow you to treat the organization as a multi-faceted cube. You can model just as much as you need on each ‘side’ of the cube. You can model the links between them, as they are and as they change over time. And that’s a revolution not only in saying how the organization can be designed and managed but also in capturing what the organization is.
*This is the end of part 5, please subscribe or visit our blog for the final part, “How HR, Finance & Strategy need to evolve for Organisation Design of the future”.