Process mapping: understand what your organization really does
If we want to map what the organization does, how do you get your head around the whole and why is it frequently called “Process Mapping”?
Stephen Covey in his book 7 habits of highly effective people said that you are what you repeatedly do. He in turn took this from Aristotle: “We are what we repeatable do. Excellence, then, is not an act, but a habit.”
It is your actions that make you what you are, is not equally true for organization? An organization has a purpose and a set of goals which need to be achieved through the business strategy. Strategy is executed through a set of actions or the activities of its workforce. It is useful to think of these activities i.e. the work, to be bundled up into processes and those processes into value streams. Arranging the employees (and contractors or suppliers) in an organized way to achieve the outcomes required to meet the goals is what organizational design is really about. This links back to earlier blogs describing the organizational system. To be clear, in this context, it isn’t just ‘process’ driven activities. It’s all ‘work’, for instance: project driven work; how a procurement is organized with engineering along category lines; how a sales force faces off to the market… These different views, however, are a subject for another blog.
A large majority of humans need pictures to help them understand our world. Approximately 65 percent of the population are visual learners. (Mind Tools, 1998). The brain processes visual information 60,000 times faster than text and visual aids in the classroom improve learning by up to 400 percent. (3M Corporation, 2001) – http://visualteachingalliance.com/
So if we want to map what the organization does, how do you get your head around the whole? Why is it frequently called “Process Mapping”? What is the “Mapping” part of this term?
Mapmaking has been an integral part of the human history from cave paintings to ancient maps of Babylon, Greece and Asia, through the Age of Exploration, and on into the 21st century. People create and use maps as essential tools to help them define, explain, and navigate their way through the world. Maps are simplifications of reality and very context specific. Most people turn off the ‘satellite’ view on their smart phones when thinking about how to drive somewhere. Process mapping in a business context hasn’t even been around for a century. Famously first introduced by Frank Gilbreth to ASME in 1921 as the presentation “Process Charts—First Steps in Finding the One Best Way”.
I love Naomi Stanford’s definition of organizational design: “Organizational design is arranging how to do the work necessary to effectively and efficiently achieve a business purpose and strategy.”
I like this in particular because Naomi talks about “arranging” the “work”. In other words, what work needs to be done and how should it all be sorted.
So how best to get one’s mind and the organization’s head around what exactly needs to be done, by who, in what way? We like to structure all the activities into processes and those processors into larger value streams and those into areas of work. The thinking behind these maps has really been inspired by decades of work with the most ubiquitous ‘visual’ tool around, the dreaded PowerPoint. For all its failings, PowerPoint is great because you can draw pictures in the free-form style. It is how executives most commonly think and communicate. From a process mapping perspective, a common language has emerged in terms of the chevron which creates buckets that happen in a particular order. Elements below the chevron can be details in bullet points. The aim is simply to aid discussion and understanding. It isn’t to get a literal view on exactly how everything happens. It is to produce a map. By simplifying reality you have a chance of understanding it.
The below are 3 examples of PowerPoint process maps that conform to the set of standards that thousands if not millions of business professionals write every day. They are all conveying how work fits together, what needs to happen and a structure.
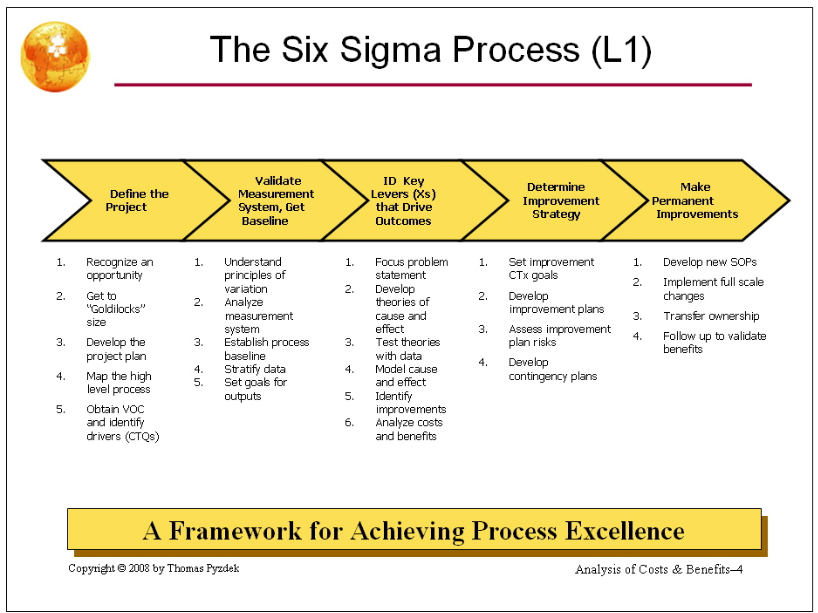
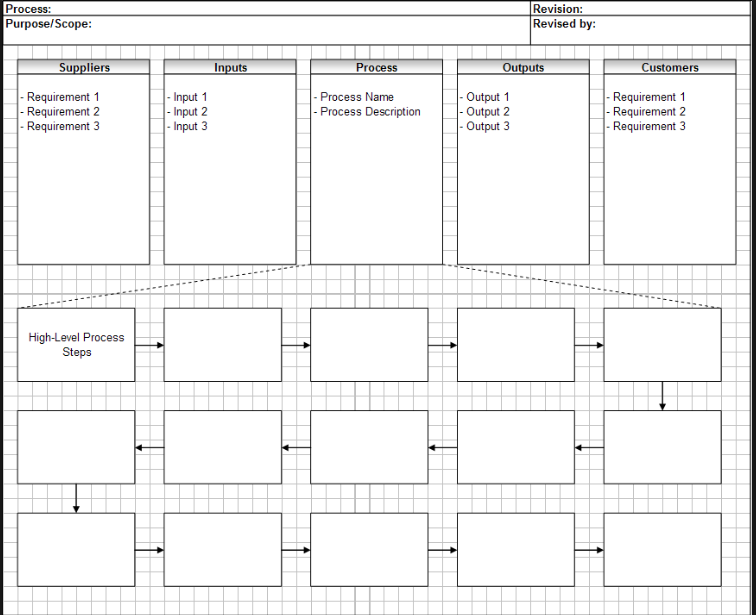
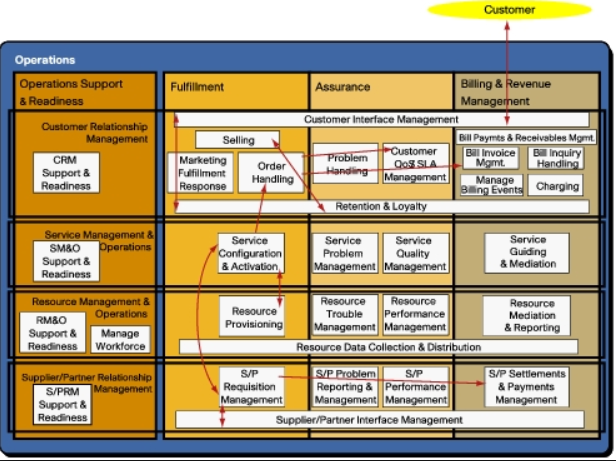
The problems with this? PowerPoint slides are enormously painful to produce. There’s no data related to any of the pieces of information on the PowerPoint slides and it’s hard to collaborate in the information generation and modification phases. The entire process happens offline with multiple versions being sent around in static files. PowerPoint was a great step up from pen and paper, which was used up until the early 1990’s, but it really is time to move on into the digital age.
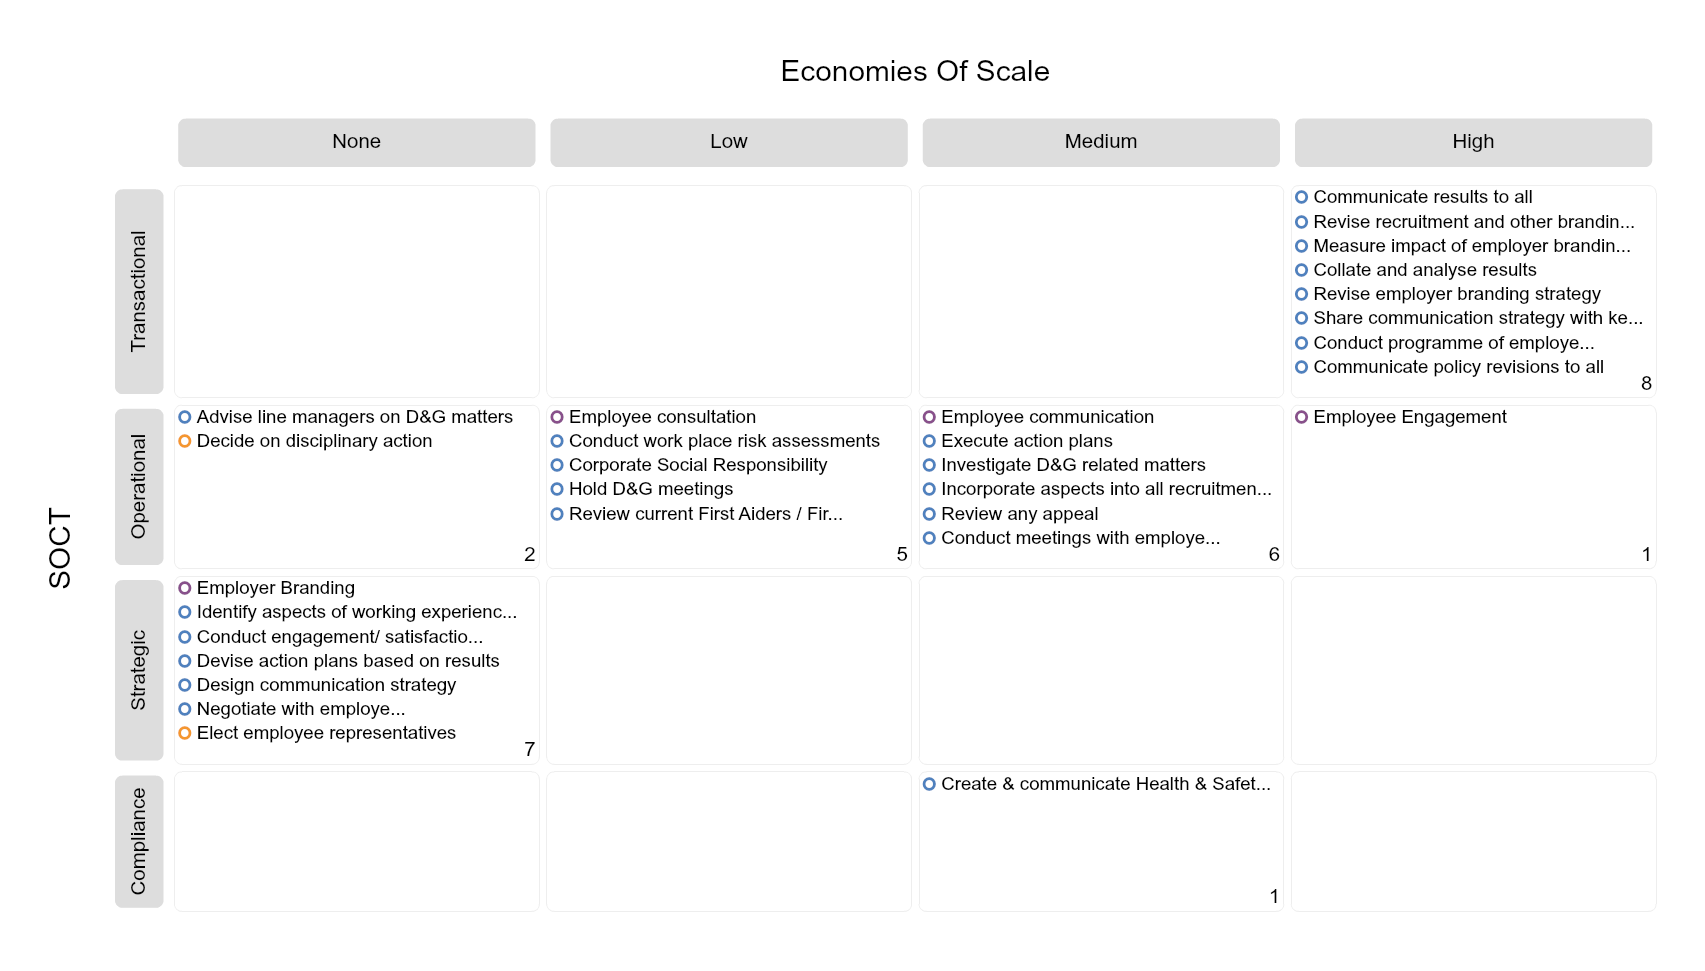
The below is an example of an Orgvue process map. Icons and colors are used to highlight the nature of the elements, e.g. is it an activity, decision or deliverable?
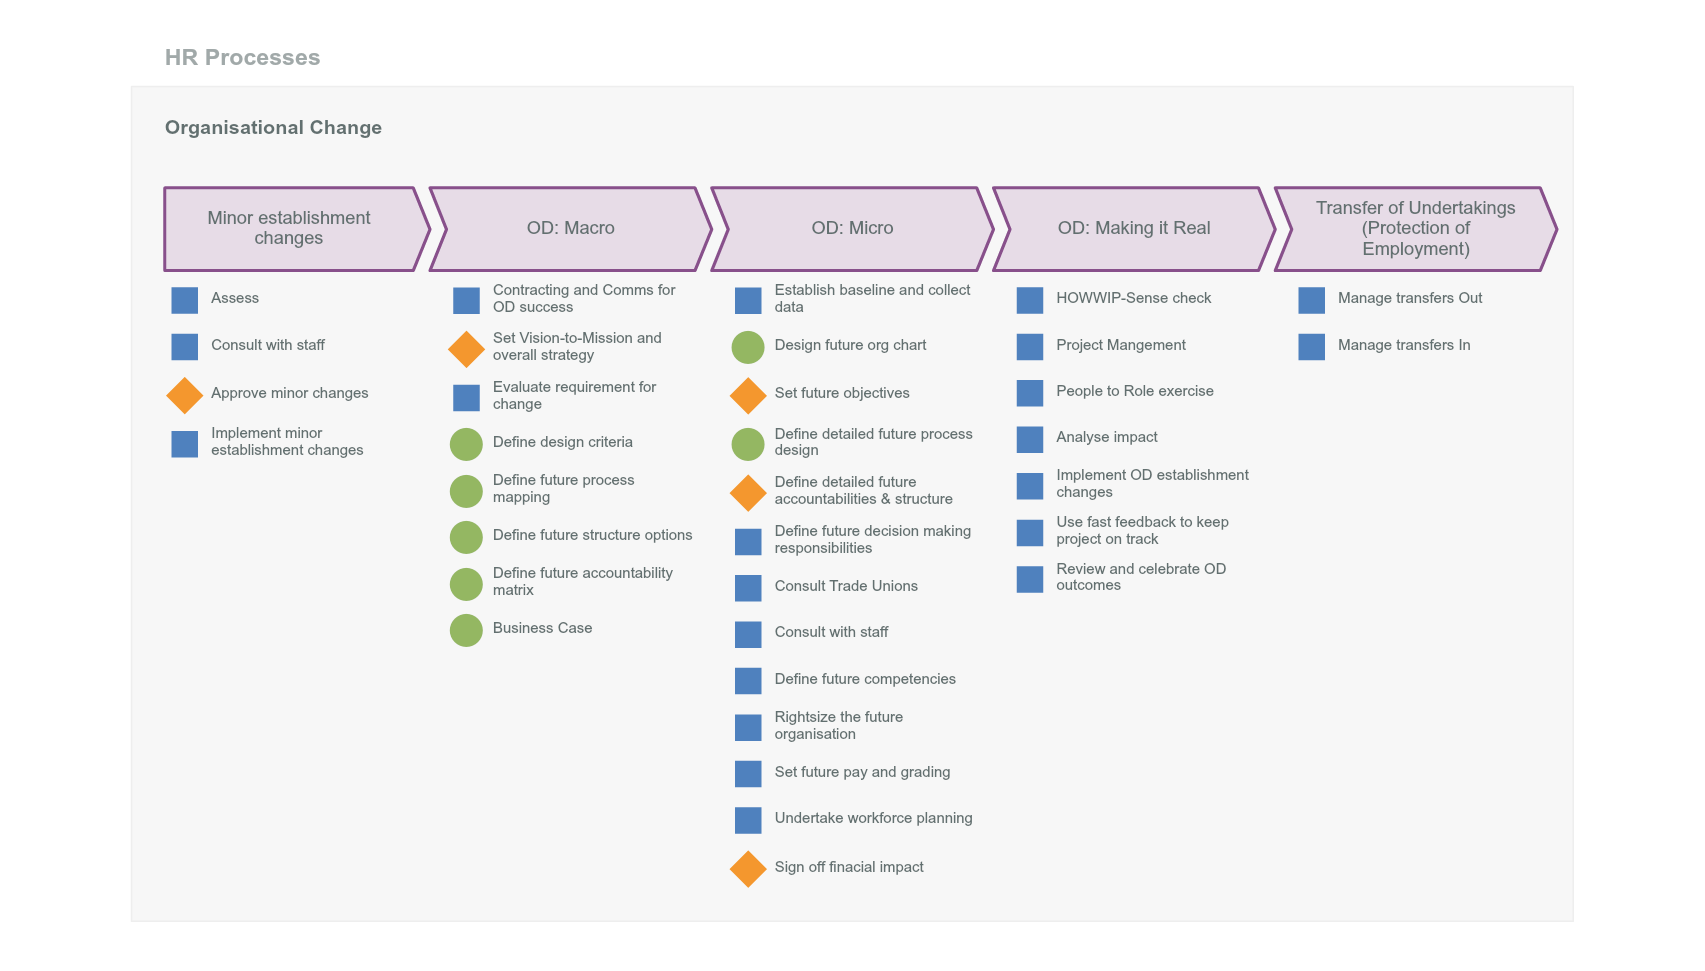
Not only can you cluster processes, you can allocate them to employees or to roles. You can define an accountability matrix. With this you can define how much time each employee needs to spend on each activity. The methodology for defining how much time each employee for each role needs to spend on each activity is a huge subject and will be covered in a later blog. Once you have this data, you have the cost of every single process. It is easy to establish the cost of each role by knowing the cost of each role you know how much cost has been spent on each process and this can be aggregated up. Some of the most exciting work we are doing at the moment is defining the cost of activities and processes. This is an entirely new take on and a genuinely practical method for doing the famous “ABC (Activity Based Costing) analysis”.
We talk about Orgvue being a revolution. This approach to process mapping leads to activity based costing, proper role definitions and job specs, the construction of proper roles… and visualizing all of it through one collaborative interface. I don’t know what you think but I believe it’s pretty revolutionary.