What is big data and what is people data?
What is the difference between ‘big data’ and ‘people data’? And how does understanding this lead to visualization of organizational design data?
Defining big data and people data
What’s the difference between ‘big data’ and ‘people data’? Big data is defined as data of high volume, high variety and high velocity. People data can be defined as datasets describing people in organizations. The two types of data will overlap in some cases and I’m sure there will be other interpretations of the differences. I’ve found it useful to try to specify what’s different between two important sources of data for analytics.
| Dimension | Big Data | People Data |
| Structure | Big datasets are better structured | People data frequently changes its structure, with new dimensions being added |
| Stability | Big datasets are more stable | People data is less stable, with the frequent creation of new datasets |
| Size | Big datasets are larger, extending to billions of rows | People datasets are smaller, usually ranging from 100 to 100,000 rows |
| Systems | Big datasets are stored on systems specifically configured for the dataset by database professionals | People datasets are created and stored on a mix of systems, including many in Excel |
| Cleanliness | Big datasets are relatively clean – with partial records cleansed or omitted | People datasets often have high percentages of gaps and errors |
| Interaction | Big datasets tend to be used for reporting | People datasets are often edited and added to with changes or comments which become part of the dataset (e.g. manager scoring of performance and notes on employee performance) |
| Source of Value | Big data can be valuable due to sheer volume, e.g. allowing regression analysis of the optimal care pathway for small subgroups amongst millions of healthcare patients. It can be valuable via linked analytics – for example, when Amazon nudges you with the suggestion that ‘People who bought this also bought…’ . | The value of people data is in overcoming the incompleteness of data, visualizing it in meaningful ways, supporting interaction, modelling and allowing linked analytics: ‘Which site manager training course was linked to the greatest increase in site profitability?’ |
Distinguishing the output of organizational design from the process of organizational design
Organizational design can be understood as an output (the thing you produce) or as an activity (something you do). I’m arguing that of course big data might change the output, in the sense of needing different numbers of people in different places. I don’t see that big data change the process. People data are different.
For the organizational design process, it’s not the large volume of data that makes a difference but the more unusual properties of people data. For example, of being imperfect, needing visualization, being reflexive and having linked relationships. These ideas are captured in the table below:
Where ‘People Data’ might affect the Organization Design process:
| What makes it people data? | Example | Change to the structure? | Change organizational design process? | Comment |
| Imperfect data – incomplete or of doubtful veracity | People data might be incomplete, but might still need to be used for org design | Could allow simpler and more flexible structures | Incomplete data could be used for incomplete design – x% adaptable | Organizations have always been re-designed on the back of napkins! However, it would be innovative if organizations were designed consciously to cope with incomplete data. |
| Visualization of data | People data particularly relevant for expressing via color, size, shapes and hierarchical structures | No direct impact on structure | Adjustment more likely if managers see where costs, skills, customer impacts are | Visualization could affect organization design – by giving a sense of the organization more intuitively, it might be more possible to achieve an organization design that makes sense to more people. |
| Reflexivity of data | People datasets can affect themselves – as expressed in the feedback loops in Silverman Research’s Social Media Garden | Doesn’t change structure directly | Yes, the org design process can evaluate its own progress and adapt | An exciting extension of the idea of group training environments where the group is explicitly invited to reflect on its own process, take ownership of it, and improve how it operates. |
| Linked relationships | People data is unusually highly linked – to processes, costs, customers, skills, engagement etc. | New role for strategy team / MI team? | Yes, monitor systemic impact during the change process | It has always been hard to link and process the data. As this becomes possible on an ongoing basis, people will be more able to reconfigure their organizations as needed. |
Imperfect or incomplete data in organizational design
Incomplete data might be seen as a problem for organizational design. After all, an organizational design is meant to treat the whole organization as a system – linking people to roles to processes, to competencies to client deliverables and objectives. For example, if we do not know how people currently use their time, how can we understand the ‘as-is’? How can we instruct people to use their time in the ‘to-be’?
Linked datasets are valuable in addressing incomplete data because they expose gaps. We understand 100% of our costs. But in a changing world, can we link them to processes? Can we link them to clients? We have listed our organization’s risks but do we know who is responsible for each one? As people’s roles change and outside factors alter risk levels, can we track who is overloaded? It is easier to sense-check this kind of analysis through linked datasets than it is through simple ‘one aspect’ datasets.
Incompleteness may be deliberate. Google’s 20% time is based on the idea that the most valuable innovations may come from unexpected areas. Google has empowered its employees to spend part of their time on whatever seemed to them to be the most valuable use. It is arguable that this ‘unstructured’ time is actually structured and managed highly effectively. The work done, the choices made and the results achieved are reviewed by peers in briefing sessions. Google’s 20% time is an example of how organizations can be designed flexibly to include information gaps, to convert unstructured innovation to structured value.
For both kinds of organizational design – a fully ‘defined’ organization or a deliberately incomplete definition – linking is powerful. Linking one dataset to another helps the organization to be conscious of where it has specified its activities, skills, deliverables, risks and where it still has gaps.
Visualization of data in organizational design
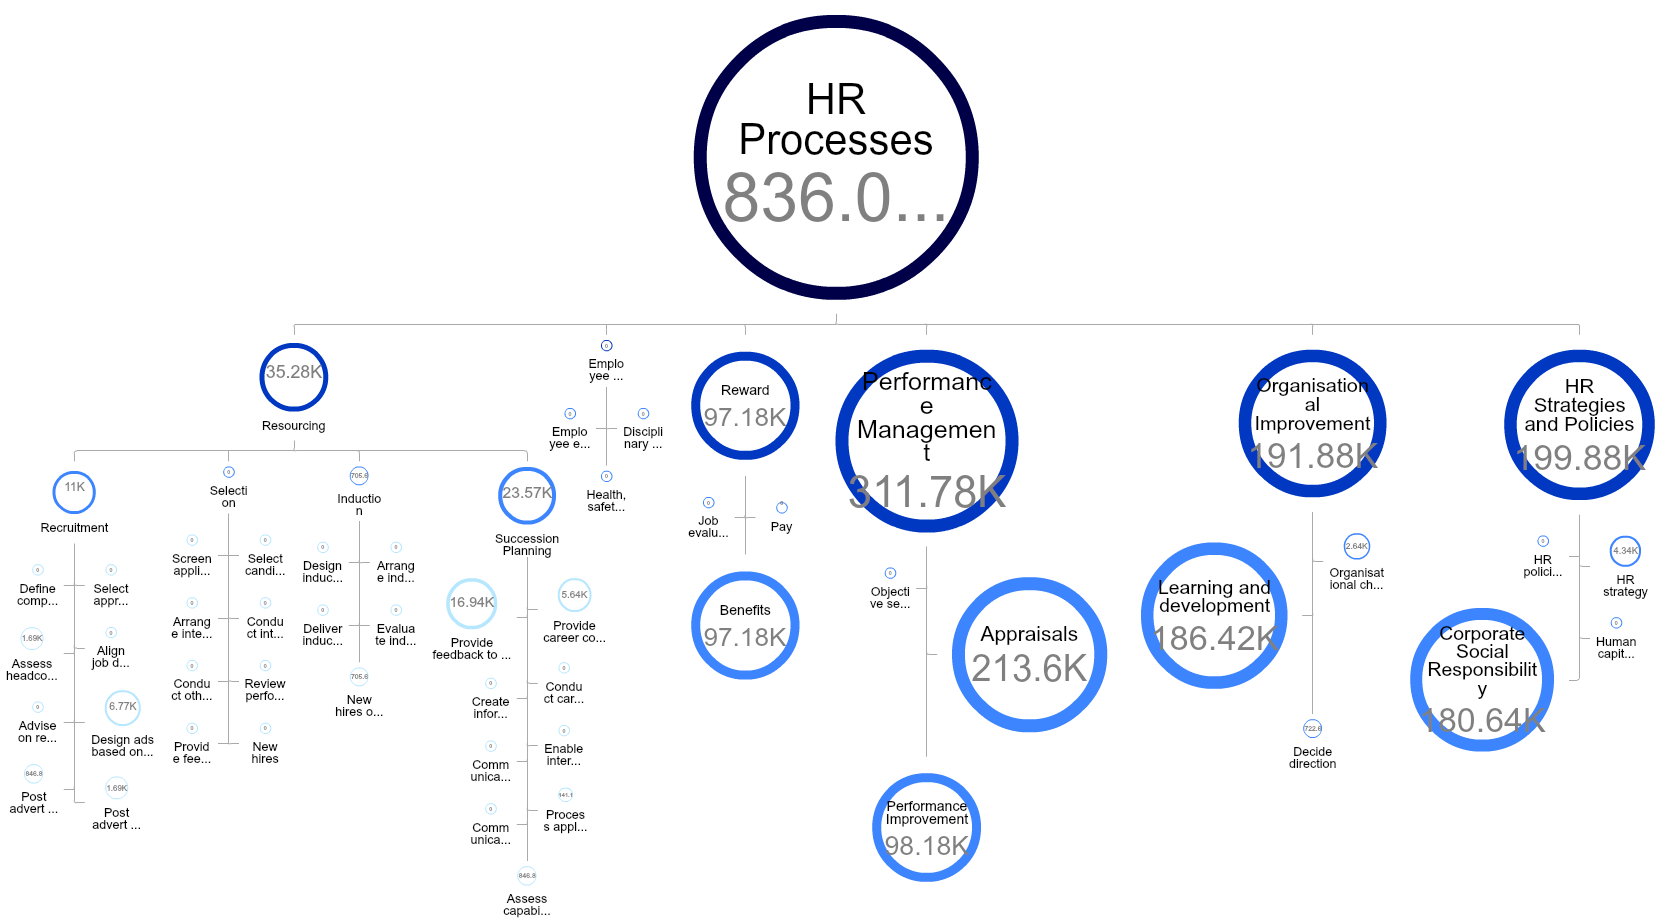
Our recent work with Orgvue has shown us that visualization affects how organizations can design and manage themselves. The example below shows a business which had historically visualized its cost in tables of numbers or bar charts per division. We mapped people to processes allowing the business to see the cost per process (in this case, a simple example for the cost of HR processes). The impact for the business was to enable the organization to see itself as a system, to start making choices around processes that need to improve and work it wanted to do in new ways:
Reflexivity of data in organizational design
Silverman Research’s ‘Social Media Garden’ allows a large group to consider ideas reflexively – not only giving their suggestions, but considering each other’s suggestions, and responding, to develop ideas over several loops and allowing the socially constructed mass of ideas to evolve:


This methodology for gathering group ideas genuinely differs from surveying due to its looped nature and differs from a ‘town hall’ meeting because of its greater potential scale and anonymity. It could be applied as a new method for organizational design, to surface issues and evaluate options.
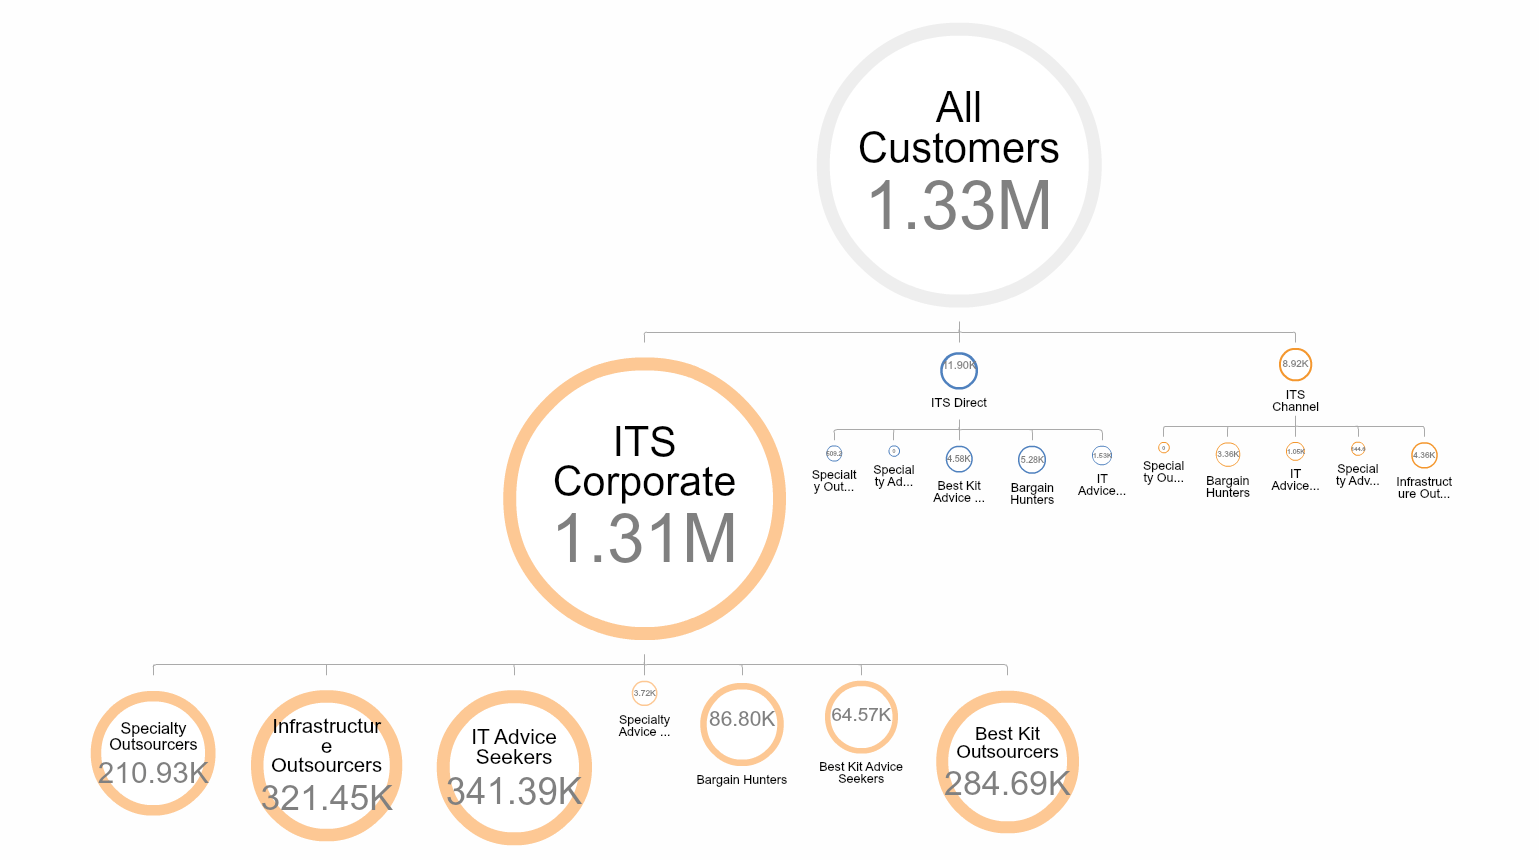
Linked relationships in organizational design
During the organizational design process, we’ve found it critical to be able to link aspects of the organization system to one another, so that impacts can be understood properly. In this example of an IT infrastructure supply company, we mapped (1) customers into customer segments, (2) processes to customer segments and (3) people to the processes that they carried out for customers. This allowed us to understand the connections between the customer segments and the true underlying cost, either at a customer level or a process level. This was vital for understanding true cost to serve per customer. It also helped drive real thinking about opportunities for process redesign.
Sample of process cost linked to customer segments: